Breaking Up With Powerpoint
I’m breaking up with powerpoint. I’ve known this day would come for a while now, but its shocking its finally here. There are academic arguments for its abandonment, but none really compelled me. The honest truth is I’ve finally found something better.
Two weeks ago I did something new, I wrote and delivered a presentation on graph theory and interactive data analysis to a mixed crowd of upper year undergrads and grad students. What was special about this presentation was that powerpoint was nowhere to be seen, not a familiar microsoft trapping in sight. This presentation was a beamer presentation. I wrote it in R Markdow supplemented with some raw LaTeX, and now I don’t think I can ever back. I’m breaking up with powerpoint, and I think you should too.
Background
If you’re not familiar yet with R Markdown, I recommend you go back and read my introduction to Knitr and R Markdown. It has become so natural to do the bulk of my work without leaving the comfortable confines of R Studio that I keep looking for more tasks I can do without switching software. Presentations were a logical next step. Previously I had dipped my toes into the problem of authoring presentations with markdown. I used ioslides (another presentation format offered by R Markdown), but was unsatisfied with the level of customization I could achieve (with my primitive knowledge of javascript). So I tried again, but this time with beamer. Beamer for those who haven’t spent much time swimming in the LaTeX pools is a convenient package for rendering LaTeX code as pdf slide-decks. I encountered beamer for first when I tried learning LaTeX originally but never had enough time or drive to master it. However, now with the added ease offered by R Markdown I decided to give it another shot.
These are the results:
The code is available from my github
Other than the relatively uninspiring title page the document came out beautifully. Figures rendered wonderfully, code seamlessly integrated into the slides, natural sub-sectioning, I can’t wait to write more like it. I recommend you quickly scroll through the document to see just how simple the document turned out to be (after code headers).
Getting Started
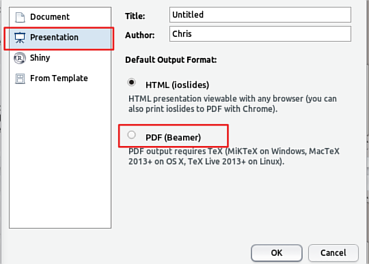
I won’t lie, there were quite a few gotchas1 along the way, but you get the opportunity to learn from my mistakes. To start a beamer presentation in R Studio, create a new markdown document as I discussed in the post about markdown, but instead of choosing the default settings, click the panel labelled presentation, then select beamer and ok
R Studio throws in some demonstration slides to give you a taste for how to make your presentation, you can go ahead an delete that (though keep the yaml block at the very top [the stuff enclosed by — ]) because I’ll walk you through how to write a really simple presentation.
First Gotcha, YAML Headers, and Themes
A problem I ran in to (yet haven’t done my due dilligence and reported it) was that I couldn’t resize the code in my document. As there isn’t a burgeoning community of R Markdown –> Knitr –> Beamer users, tracking down which component of the pipeline isn’t working right and finding a fix is challenging. I found references to a workaround by Yuihui Xie (the creator of Knitr) for getting the code to the right size, but it didn’t work for me, and supposedly is no longer necessary anyway. He was using Knitr –> Beamer so the issue could be in R Markdown. I created a work-around that made the code font smaller but left the output font gargantuan, it was sufficient for my purposes. You can grab the modified template I used from my github by running:
library(RCurl)
gistUrl <- "https://gist.githubusercontent.com/datamancy/b5ba7767d7729bd676a2/raw/987d43694eda1fc263efdd38af03f846db80e690/resizeTemplate.beamer"

write(getURL(gistUrl), "resizeTemplate.beamer")
Then you can add template: resizeTemplate.beamer to your yaml header. Also if you’re interested in using a theme to beautify your document you can add that in the header as well:
---
title: "A title"
author: "Your Name"
date: 'Today's date'
output:
  beamer_presentation:
    theme: "Boadilla"
    template: resizeTemplate.beamer
---
I used the theme boadilla but there are many others to choose from. To find the theme that’s right for you check out the gallery by Ian Blaines to see one presentation rendered in many different themes.
Slides
Once that is set up, you can start writing your presentation. By default, new slides begin with every level 2 header, or line break. To create two slides (plus your title slide) you can add the following code to get a titled slide and an untitled slide:
## Slide 1

Some Slide Contents!

------------------

Untitled slide 2
Images
Next thing you might want to try is to add some images into your documents.
To add pictures, you can use the default markdown code:
But I found myself unsatisfied with the default sizing and positioning. I wanted a centred picture of a certain size. To achieve that I needed to write some raw LaTeX
\centering \scalebox{0.45}{\includegraphics{path/to/pic.png}}Centering indicates the line should be centered, and since LaTeX treates included graphics as large characters that will center your image. The \scalebox command resizes the image as you’d expect (with numbers larger than one expanding it). All and all not too complicated.
Bullet Points and Sequence
To have a series of bullet points in your slide you just need to create a bulleted list the default markdown way
#Bulleted Slide

- Isn't
- This
- Easy
And you’ll get a nice bulleted slide. If you’re like me and want some but not all of your bullet points to come in sequentially you can add incremental = true to your yaml block after beamer_presentation: but I found it easier to leave that out and specify manually where I’d like my bullets to be sequential. To force sequential bullets (or if incremental is true to force static bullets, which isn’t documented on R Markdown’s webpage) you just need to add the greater than sign before the bullet.
#Sequential Bullet Slide

>- Wait for it
>- .
>- ..
>- ...
>- Point!
Images can be made sequential too by putting them in a sequential bullet.
Bullet Spacing
The applies to line spacing in general, markdown ignores extra white space by default, so trying to force extra space between points isn’t as easy as one might hope (although there is probably a way to do it with your LaTeX header or yaml header). The solution I found was to manually include LaTeX line-breaks
#Spaced Out Bullets

- Point 1 \newline
- Point 2 \newline
- Point 3 \newline
Which is useful if you, like me, try to keep text to a minimum so using white space effectively is key.
Resizing Font
To resize font in your document you can use LaTeX’s font sizing codes e.g. (\large{your text}, \Large{your text}, \tiny{your text}, etc.)
This was useful for me to make better use of the slide space with sparse text (lots of line spacing and a bigger font), and for emphasis without using headers which can trigger some unwanted stylistic changes.
Outro
With that you now know about as much as I do about creating presentations with Beamer via Knitr via R Markdown. It’s pretty straight forward, if you ever do presentations that involve code, equations, and figures I can’t recommend it enough. I hope you’re inspired to try your next presentation without powerpoint.
-Chris
Bonus Trick For Those interested: in the presentation, the red X and green check mark were made using grid graphics directly from within R. I previously wrote a little about using ggplot2 in unexpected ways, this used some of those lessons. By using the grid package directly you can draw whatever you like on a plot canvas, check out the presentation code for how I did it.
“Gotcha” is a programming term for a little irksome quirk of a language or tool that cause it to perform in unexpected or counter intuitive ways↩